
Working Years Case Study (ages 30-50)
The Family Profile
Parents: Ages 40 & 39 (planning for retirement at age 70)
Children: Ages 6 & 8 (college funding prioritized)
Home & Debt: Homeowners with a 20-year mortgage, intending to pass the home to their children as an inheritance.
The Goal: Balancing Life Today with Confidence Tomorrow Our primary focus for this stage is maximizing your after-tax, lifestyle spending throughout your working years and retirement—without compromising your mid-career priorities like college savings or mortgage payoff.
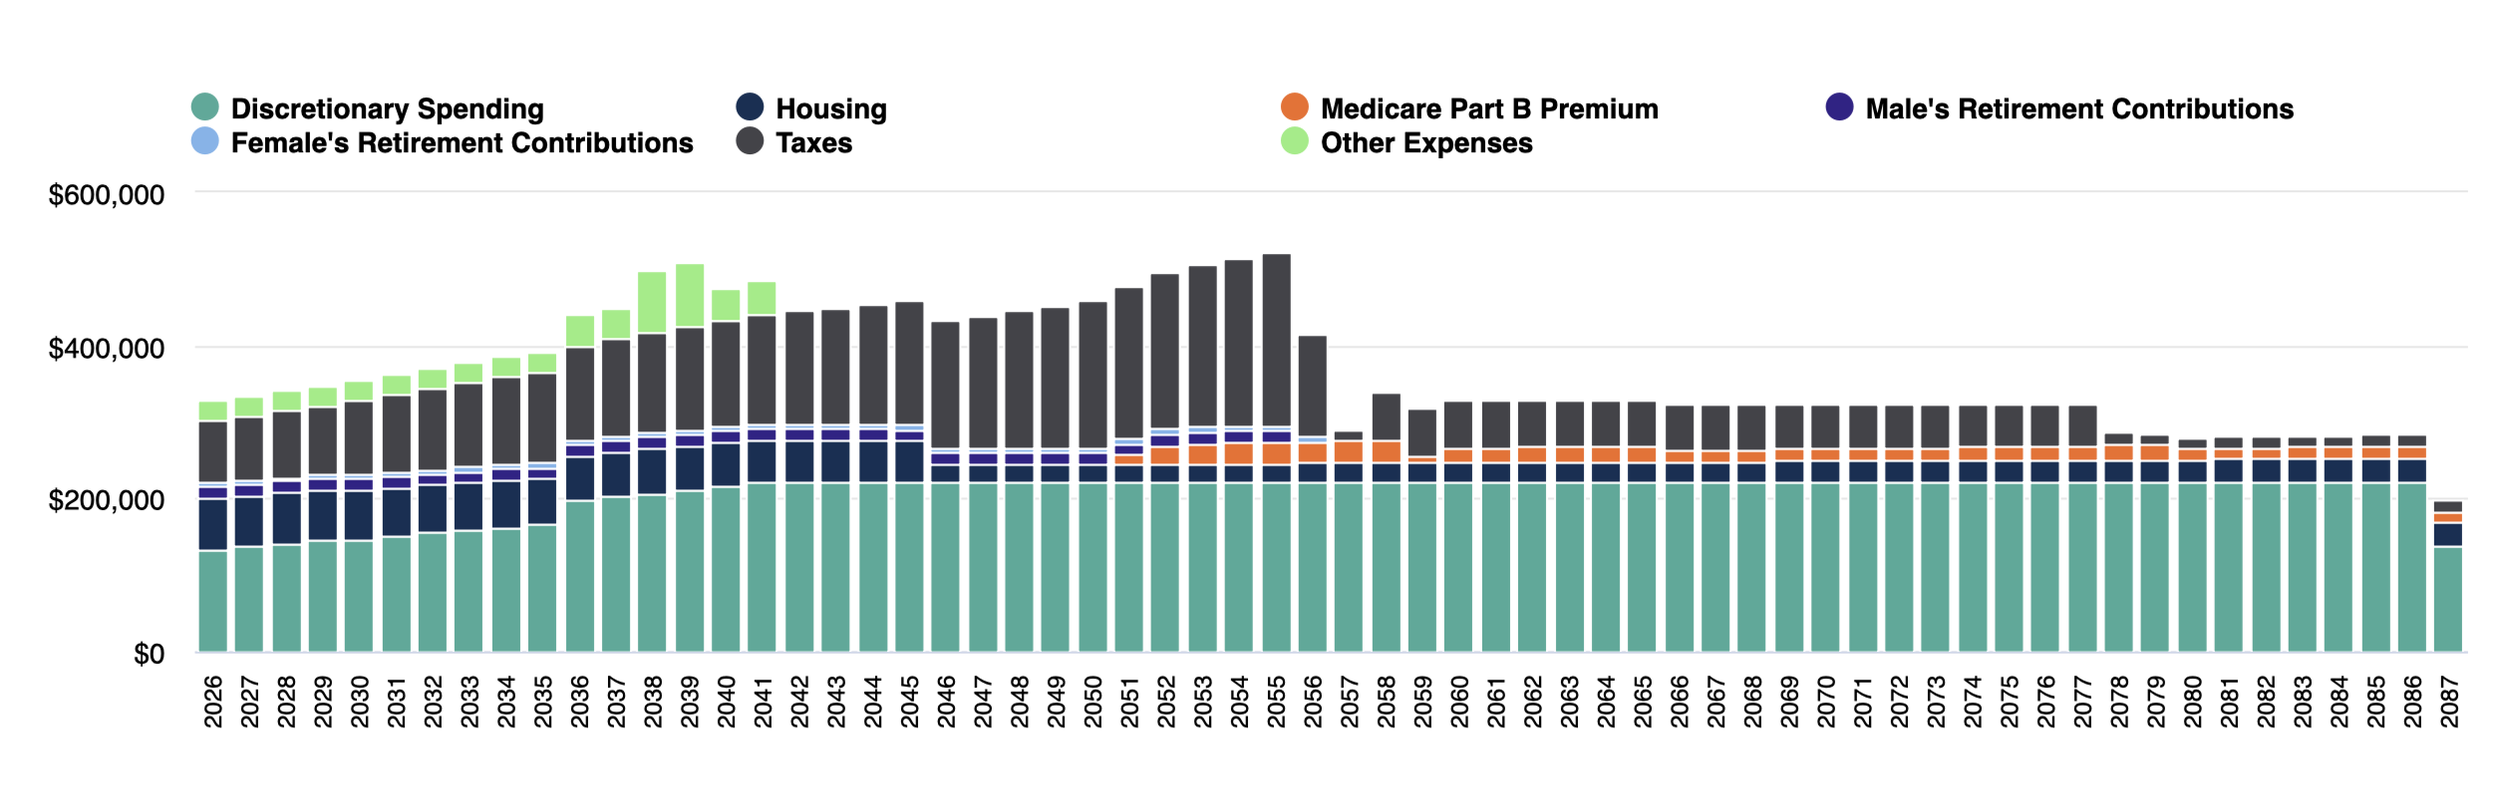
What This Chart Shows You:
Green Bars (Lifestyle Spending): The actual money available for family enjoyment, vacations, and daily living each year after all taxes, housing, and fixed expenses are covered.
Early-Year Balancing: Demonstrates how current savings and income are managed during peak expense years (like college funding) while keeping future retirement on track.
Lifetime Trajectory: Gives you a clear visual map of your spending power through age 100, allowing us to adjust retirement timing, tuition contributions, or lifestyle goals in real time.
College Funding & 529 Strategy
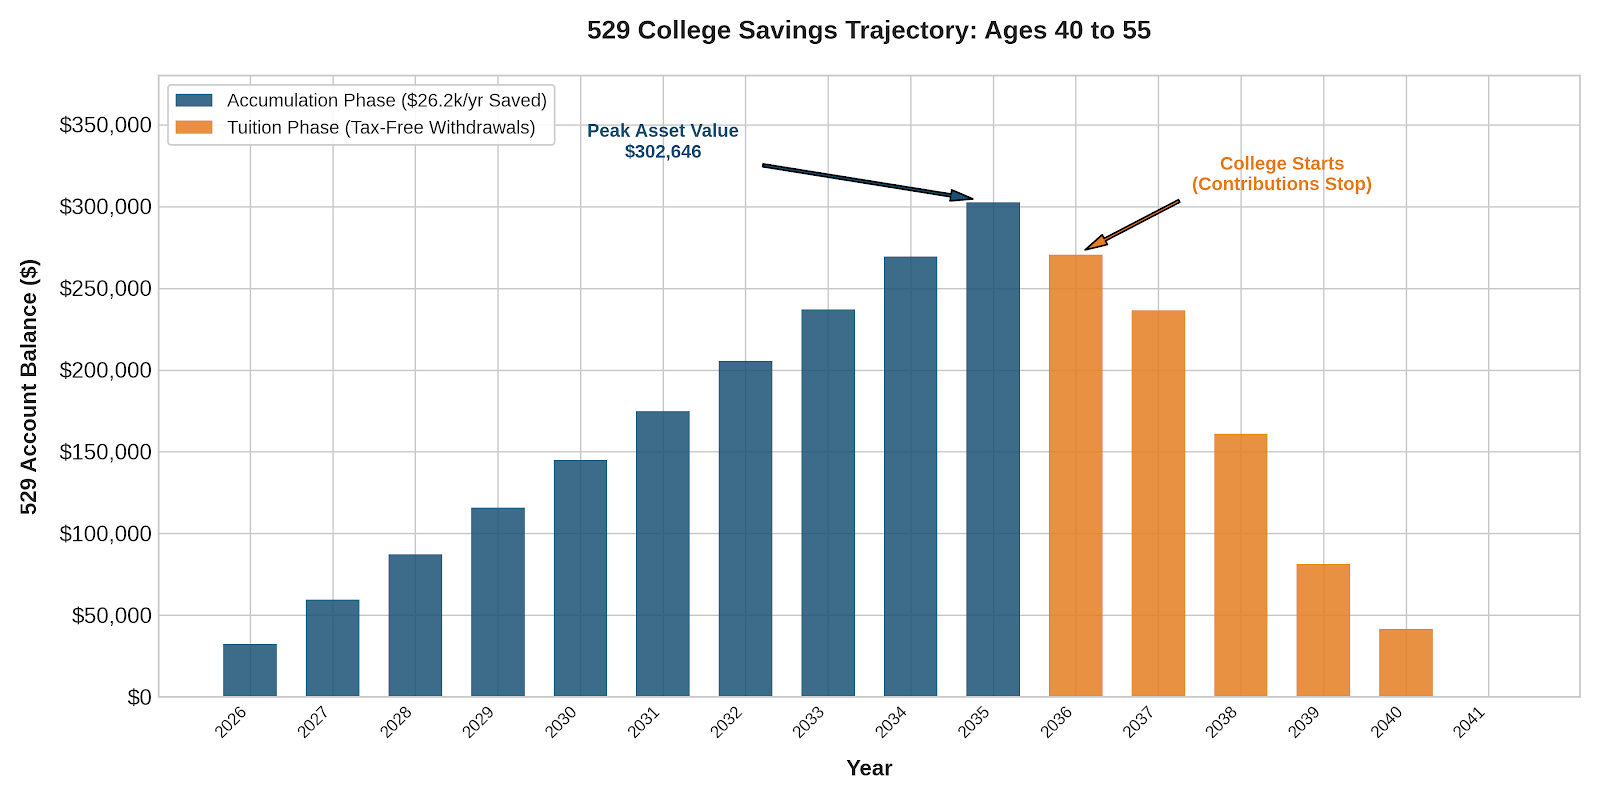
To support the lifetime plan shown above, we drill down into specific big-ticket goals—starting with education. This report maps out the exact annual funding required in today’s dollars to fully cover four years of college for both children, eliminating guesswork and preventing overfunding.
How This Strategy Works:
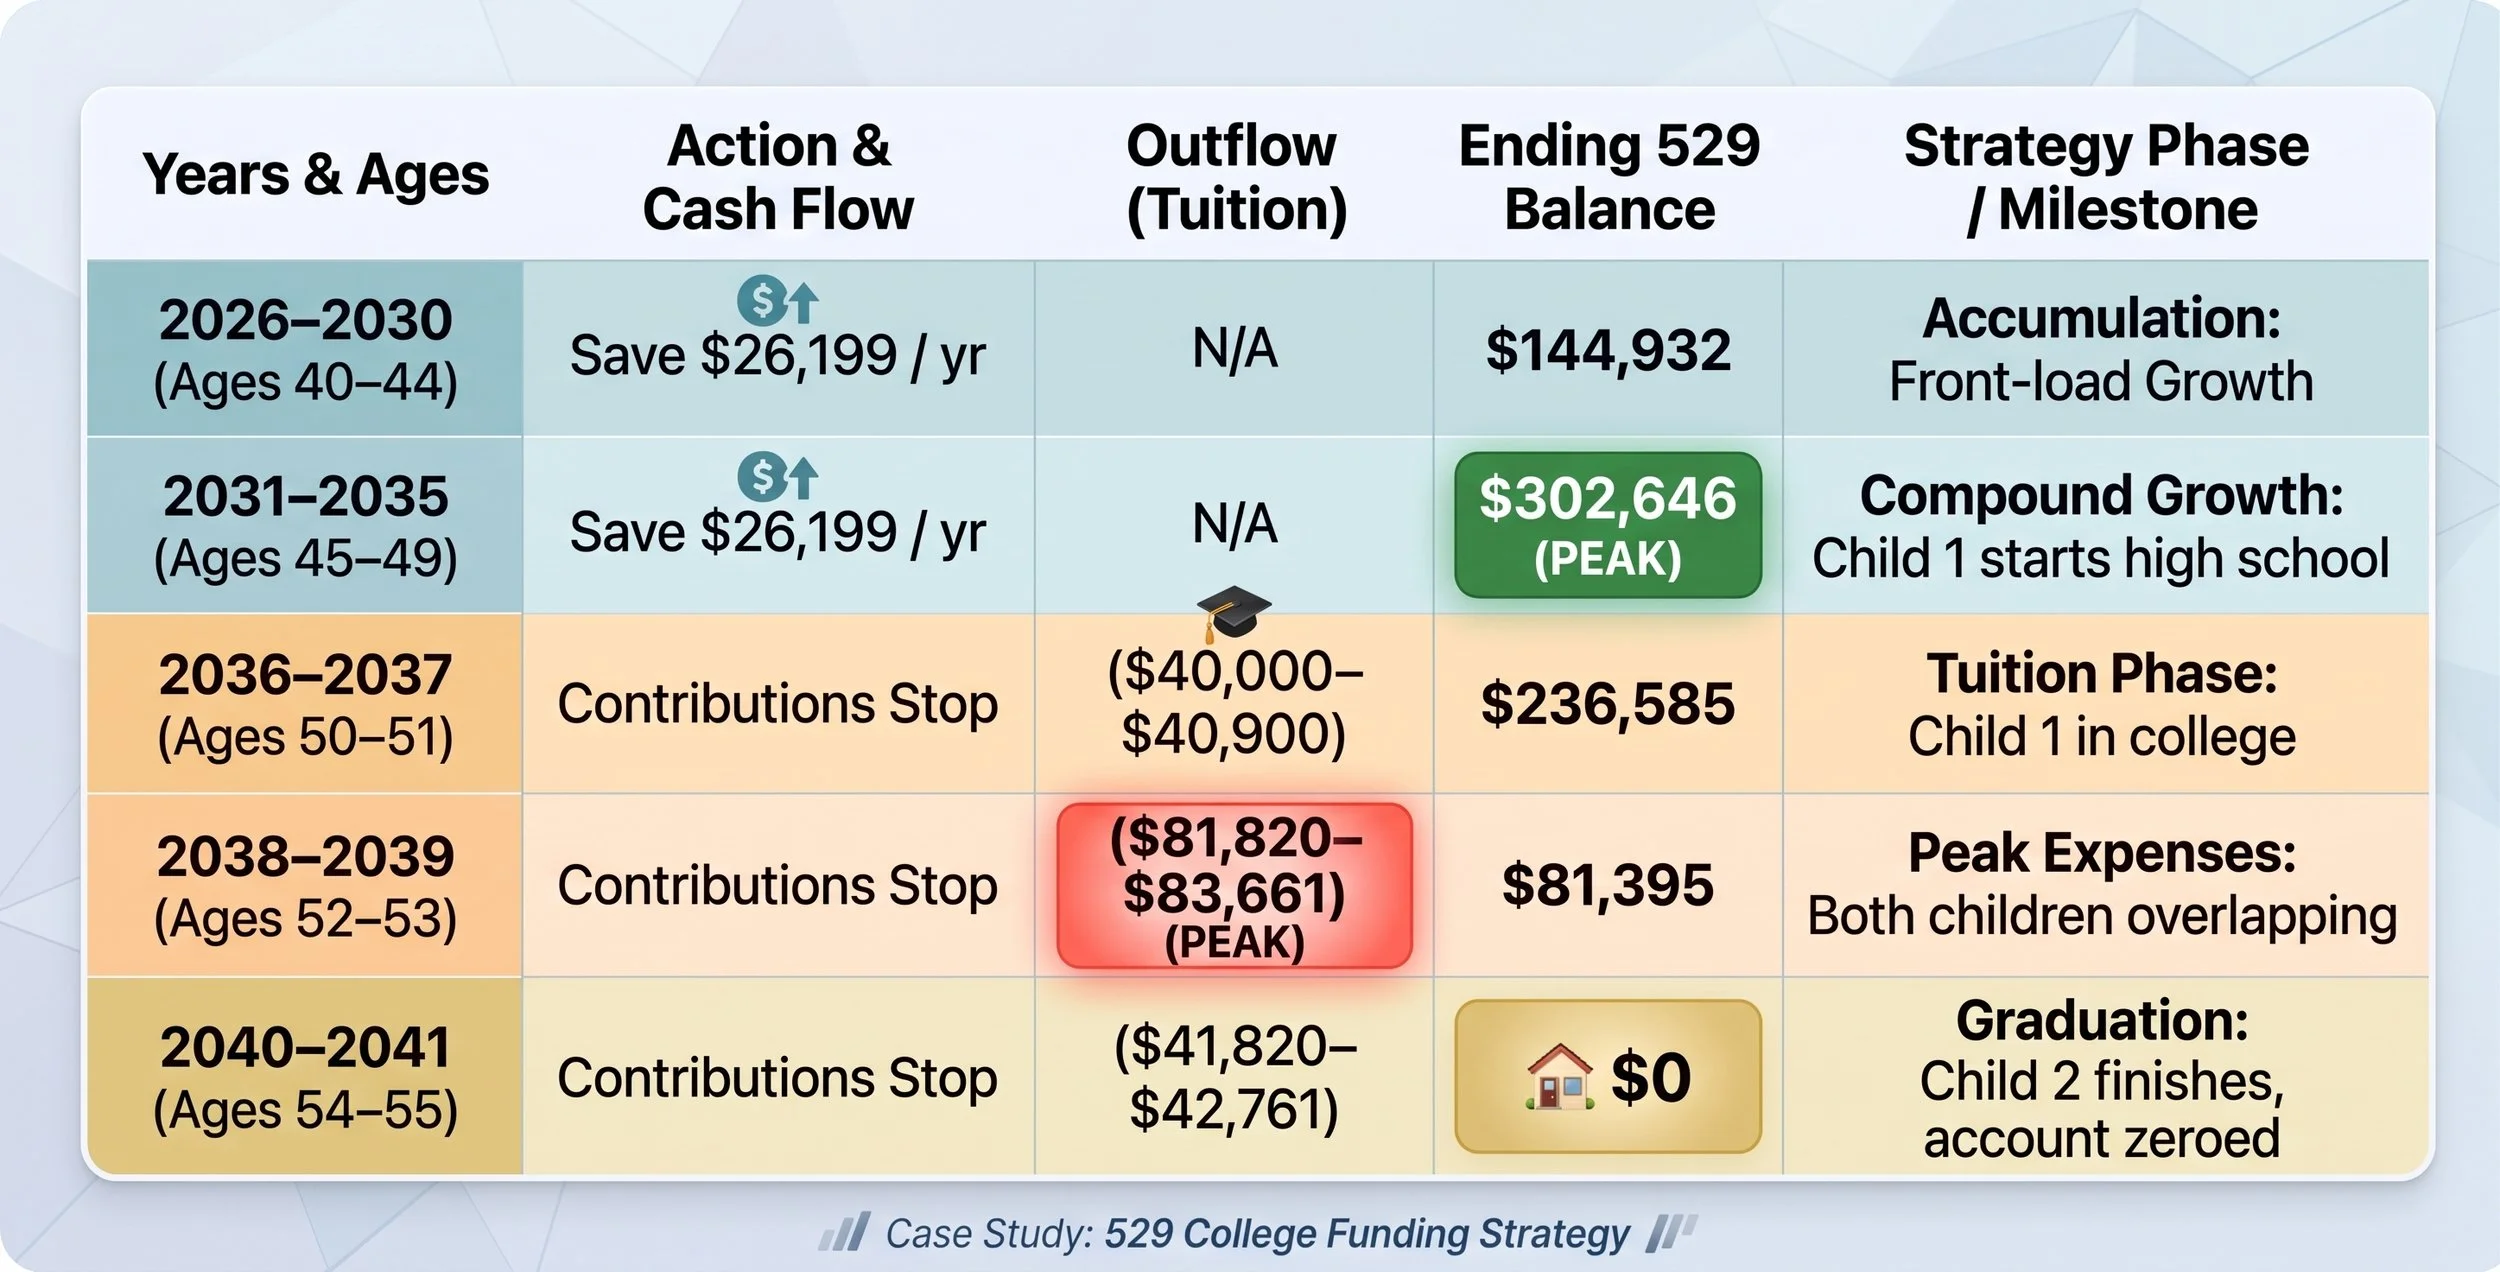
10-Year Accumulation Window (2026–2035): The family contributes $26,199 annually while the children are young. This front-loads compound growth to maximize tax-free earnings inside the 529 plan.
Contribution Pause at College Age (2036+): When the oldest child starts college in 2036 (parents age 50), contributions drop to $0. The accumulated asset pool of $302,646 takes over to fund remaining tuition bills.
Tax-Free Distribution Phase:
2036–2037: $40,000+/year for Child 1.
2038–2039: Peak college expenses (~$81,000–$83,000/year) as both children attend college simultaneously.
2040–2041: Final tuition years for Child 2.
Zeroing Out Tax-Efficiently: The account gracefully lands at $0 upon graduation—funding 100% of their education goal without leaving excess funds trapped in tax-restricted accounts.
Granular Transparency: Every Dollar Accounted For
High-level estimates are great, but real confidence comes from seeing exactly how the math works under the hood.
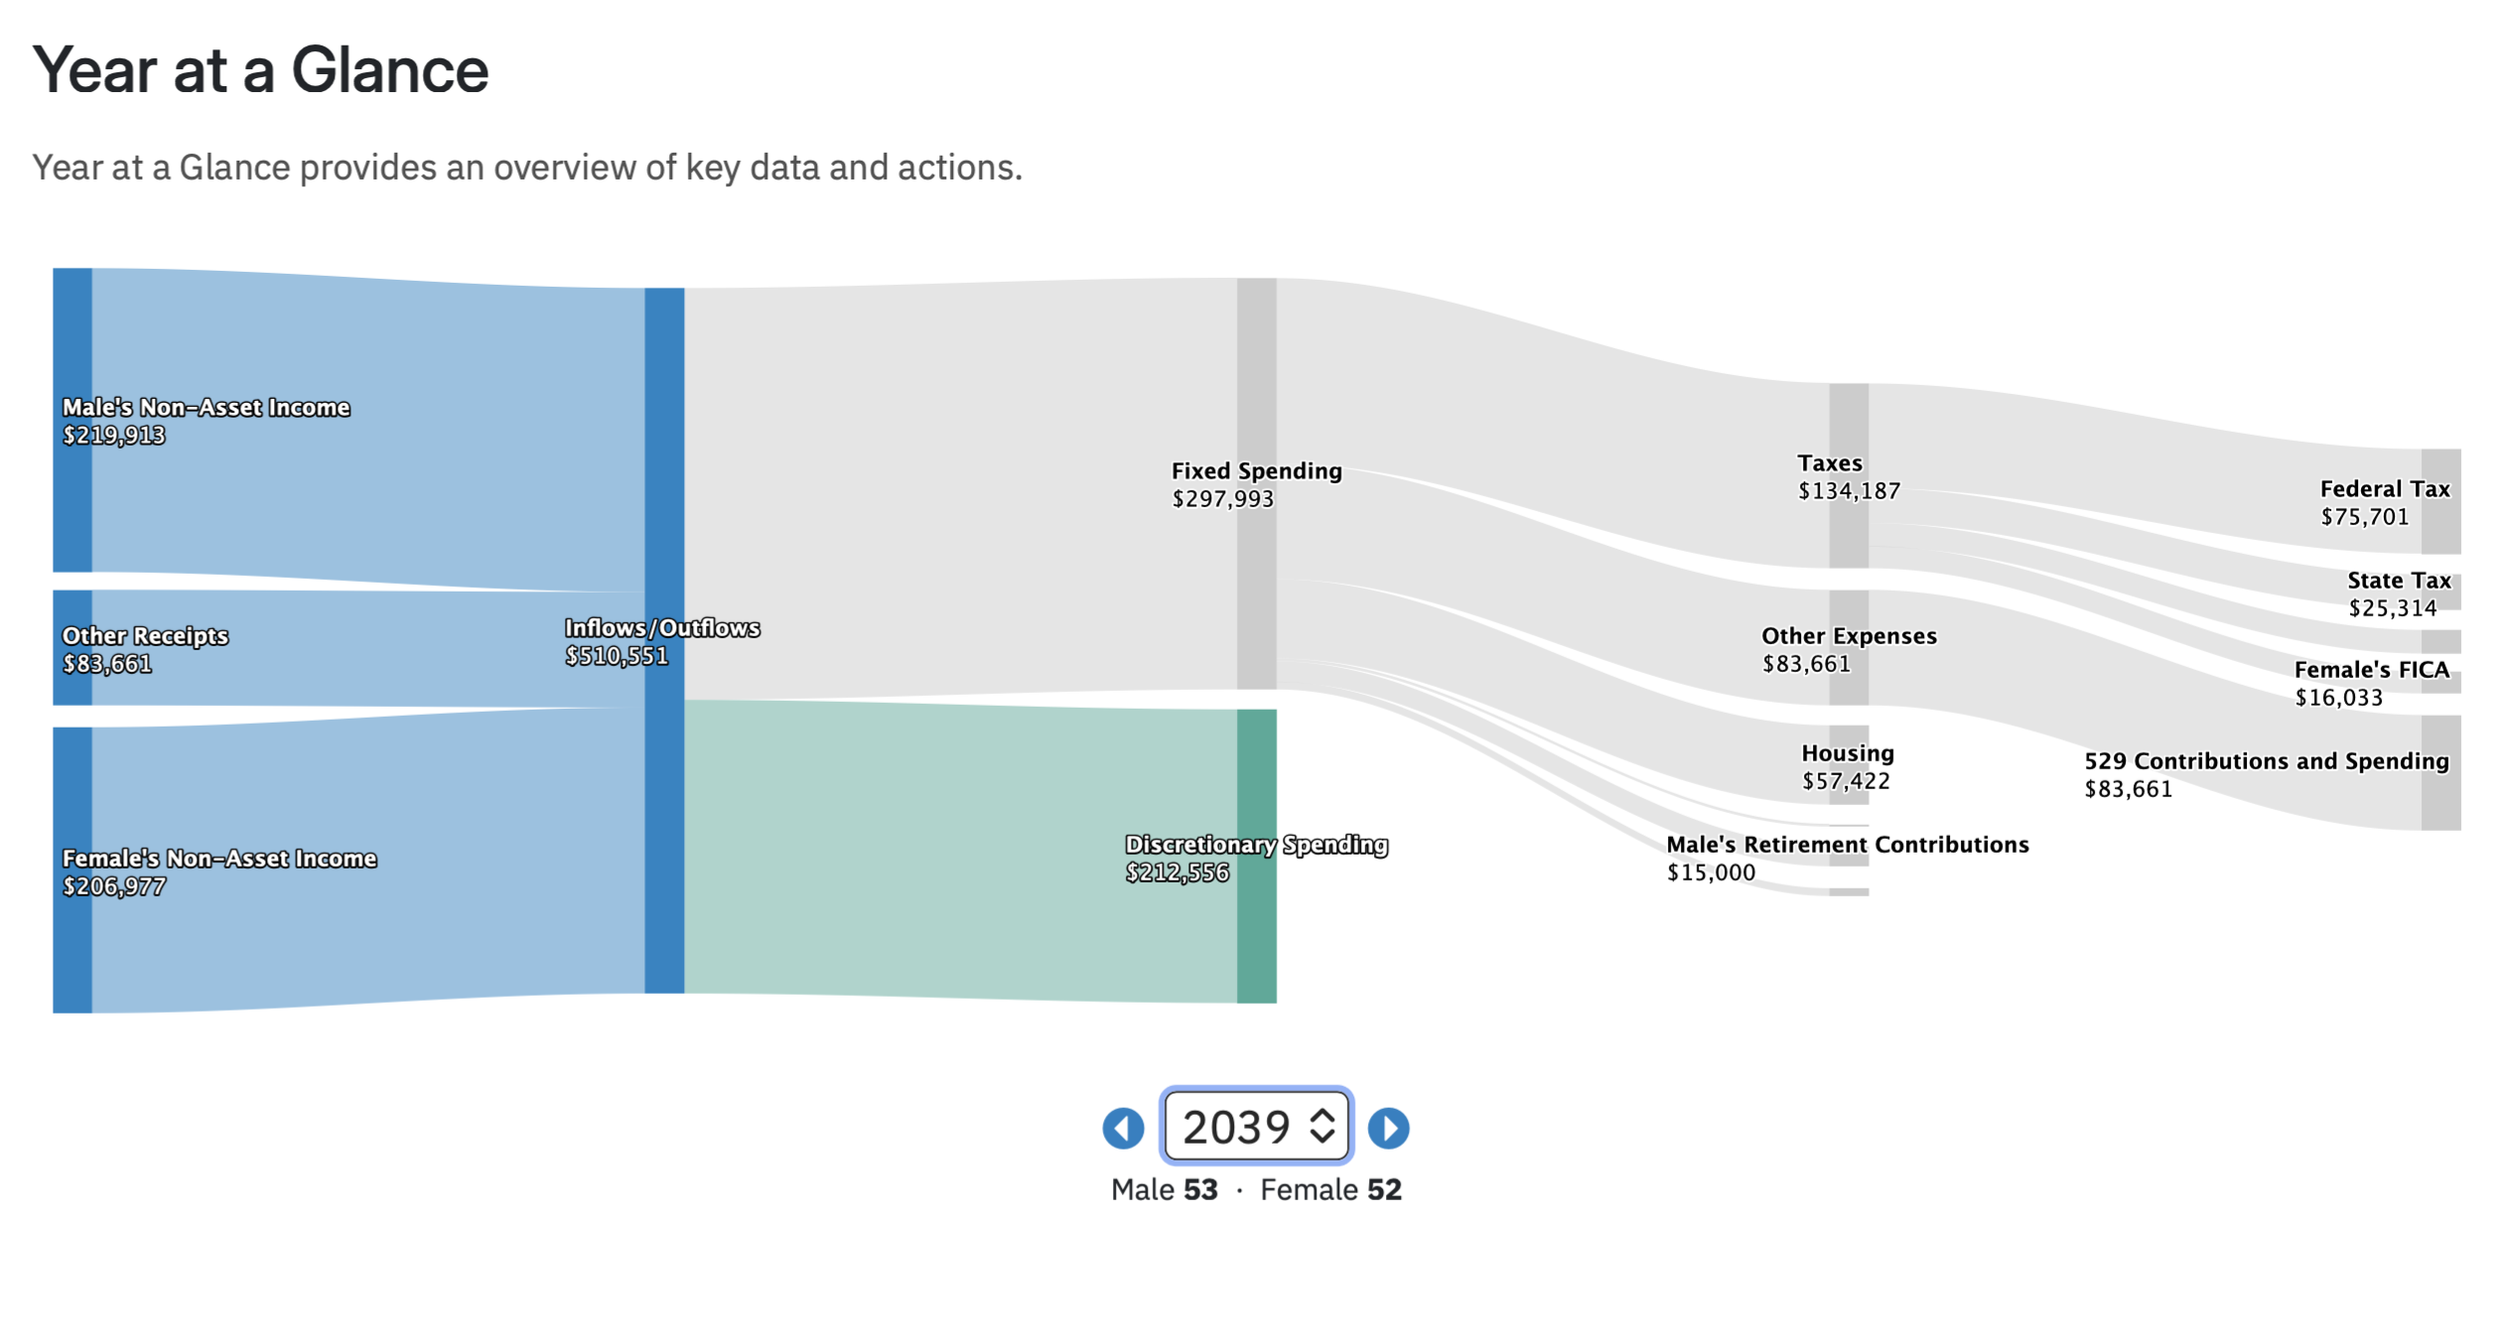
To ensure your plan is a true reflection of your life—and not a black-box estimate—we audit your cash flow year by year. Below is a snapshot of 2039, the single highest expense year for this family, when both children are in college simultaneously.
What This Flow Diagram Proves to You
Complete Cash Flow Accounting: You can track every dollar of incoming income on the left, through to tax payments, tuition spending, retirement savings, and your lifestyle budget on the right.
Peak Year Stress-Testing: In 2039, the chart captures the overlapping $83,661 in 529 tuition spending coming out as an expense, funded by the tax-free withdrawals built up in earlier years.
No Hidden Gaps: It explicitly verifies that even during the heaviest spending year of their lives, housing is paid ($57,422), taxes are fully accounted for ($134,187), retirement contributions continue, and over $212,000 of discretionary lifestyle spending remains intact.
The Takeaway: We don't just tell you that your college plan works—we model every single calendar year to prove your lifestyle remains protected through peak tuition, mortgage years, and beyond.
Protecting the Trajectory: Self-Completing Your Plan
Even with a crystal-clear cash flow model like 2039, a great plan shouldn't rely on luck. While our primary focus is building wealth while you are both healthy and earning, a robust plan must guarantee that your family's financial security stays intact—no matter what happens along the way.
We view term life insurance not as an extra expense, but as a self-completing mechanism for your family’s vision. It ensures that if one spouse passes away prematurely, the remaining family still reaches 100% of the goals you built together.
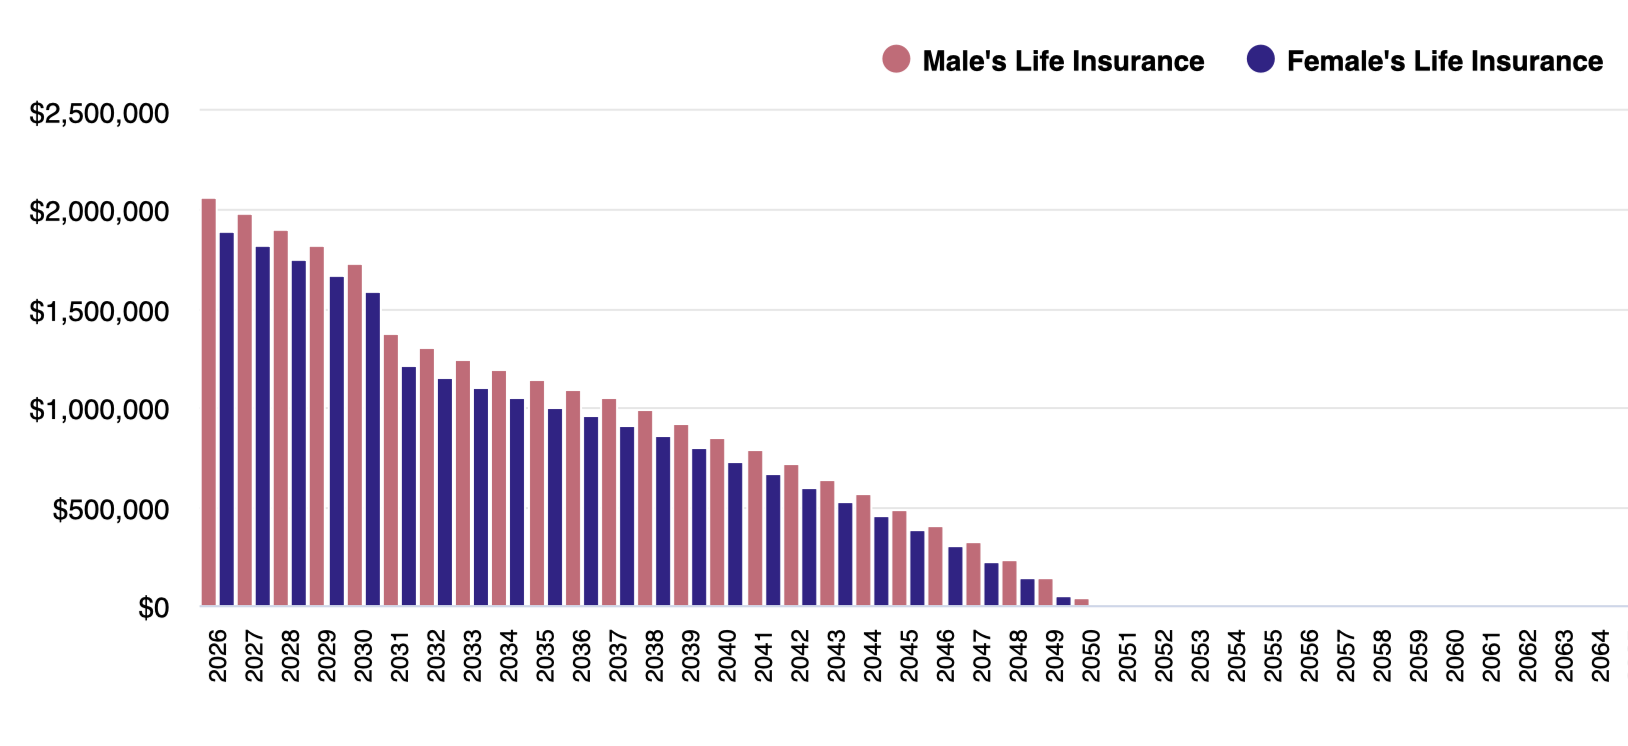
What This Coverage Map Shows You:
Peak Protection When Exposure Is Highest: In the early working years (Ages 40–45), your coverage need is at its highest (~$2.0M for Him / ~$1.8M for Her). This guarantees that the mortgage, college funding, and ongoing lifestyle spending shown in your annual cash flow diagrams remain fully secured.
Efficient, Shrinking Reliance: As your 529 accounts grow, your home equity builds, and your investment portfolio compounds, your need for insurance naturally declines. You may want to consider a base policy for 30 years and then add 10 or 20 year term riders to reduce your costs and more closely match your protection needs.
Phasing Out at Financial Independence: By the time you are in your 60s—as college expenses wrap up and your net worth takes over—the insurance requirement drops to $0. Your portfolio becomes fully self-funding for retirement.
The Takeaway: Life insurance in a LifeSpend Plan isn't about dwelling on the worst-case scenario. It’s about giving your family complete certainty that tuition gets paid, the home stays secure, and your lifestyle continues without interruption.